Contents
How to avoid customer churn with a predictive model
In this tutorial we share how to do churn prediction using Machine Learning. You’ll will be able to create a predictive model that will help your team to predict and identify customer turnover.

Customer attrition, turnover, defection, or churn, is the loss of clients or customers. As you can imagine, it is a critical metric for companies like SaaS businesses that base their value proposition on a subscription-based model. In this post we’ll explain why it’s an advantage to keep track and predict customer turnover. Also, we’ll share with you the steps needed to develop a predictive model. This tool will help you identify if a customer will churn based on the data.
What is customer churn?
Customer churn is one of the most important business metrics. That’s because the cost of retaining an existing customer is significantly less than the cost of acquiring a new one. The latter is often referred to as Customer Acquisition Cost (CAC). Companies use it as a metric to track if a company has a viable business model that can keep profits generating while maintaining a low CAC .
Historically, big companies like telephone services, internet providers, insurance firms and others performed customer attrition analysis. Nowadays it is often used by SaaS businesses and those adopting a subscription based model. According to Profitwell analysis, the average monthly revenue churn rate could be anywhere from 1% to 17%. In addition, most studies report that the median monthly churn rate in the 5-10% range.
What is the Average Churn Rate for SaaS?
The analysis and predictive analysis of customer attrition for SaaS companies is extremely important! Mainly because monthly recurring revenue is the main source of return. It is crucial to track recurring profit lost by churn, customer acquisition cost and customer lifetime value, which all define how valuable a customer is.
An important benchmark for SaaS businesses is the Mythical 5% which states that an acceptable churn rate is in the 5% – 7% range annually. Simple math supports the logic behind this statement. For instance, in the case of a SaaS business with 1000 customers, the 5% annual churn would be a total loss of 50 customers. In contrast, a 5% monthly churn would incur a loss of 460 customers annually, almost half of the customer base!
Telecom providers, financial services and insurance firms often have customer service teams to winning back defecting clients. That’s because recovering long-term customers can be more valuable to a company than newly recruited clients.
Voluntary vs involuntary turnover
Companies usually make a distinction between voluntary churn and involuntary churn. Voluntary churn occurs due to a decision by the customer to switch to another company or service provider. On the other hand, involuntary churn occurs due to extenuating circumstances, such as a customer’s relocation to long-term care, death or relocation to a distant location. In most applications, people exclude involuntary churn from analytical models.
Analysts tend to concentrate on voluntary churn, because it typically occurs due to factors companies can control, such as how billing interactions are handled or how after-sales support is provided.
Customer churn prediction using machine learning
Predictive analytics use churn prediction models to forecast customer churn by assessing their propensity of risk to churn. Since these models generate a small prioritized list of potential defectors, they are effective at focusing customer retention programs on the customer base that is most vulnerable to churn.
In the following sections I’ll lead you through a step by step creation of a predictive model that will help your team identify customer turnover rates.
How to get your churn prediction using Machine Learning
Setting the Environment: churn prediction with Kaggle
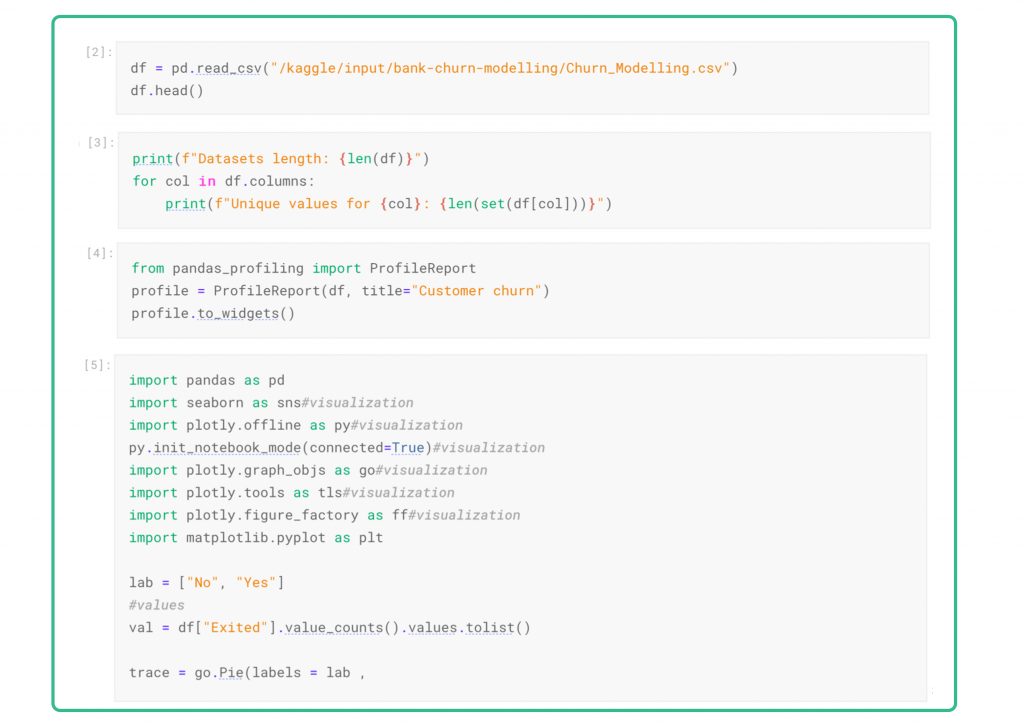
For this post we prepared an example available on Kaggle. Kaggle is an open data-science platform using an environment called Jupyter. Using this environment, data scientists can collaborate, inspect and transform the data, produce visualization and execute experiments. What you see on the page is often referred to as Jupyter Notebook or just Notebook and it’s a common data science environment. Here we can explore the data, execute code from different languages like Scala, javascript and R. In our case, we are going to use python and plot graphs to run our experiments.
A jupyter notebook consists of cells of code that we can run just by selecting the cell and pressing the run button or by using ctrl+enter.
Exploratory Data Analysis (EDA) of the example data
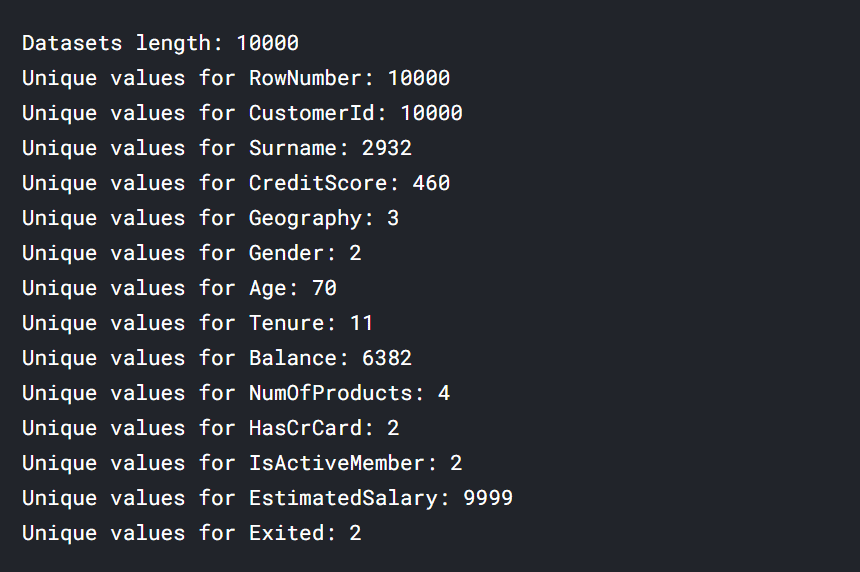
As an example for this post, the dataset used for this analysis consists of customer data from a financial service institution. This data is anonymous and it’s public in the Kaggle platform. It consists of 14 columns and 10000 rows.
We produced some initial insights trying to identify the cardinality of the data:
- high cardinality columns are columns with values that are very uncommon or unique (surname, balance).
- low cardinality columns have very few unique values and their values are typically status flags, boolean or major classifications such as gender.
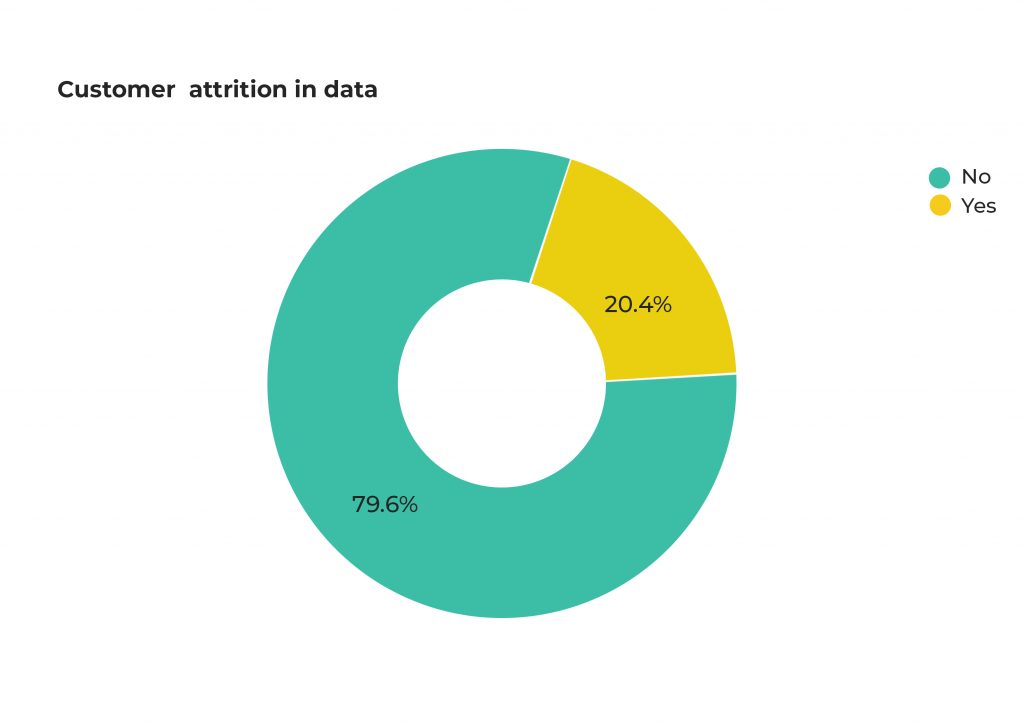
The departing customers have already been identified by the owner of the dataset and flagged as 1 in the column Exited. If you have not already identified the clients who have historically churned you should do that before you continue.
Using this column we can plot a pie-chart to better illustrate the level of customer attrition in the data.
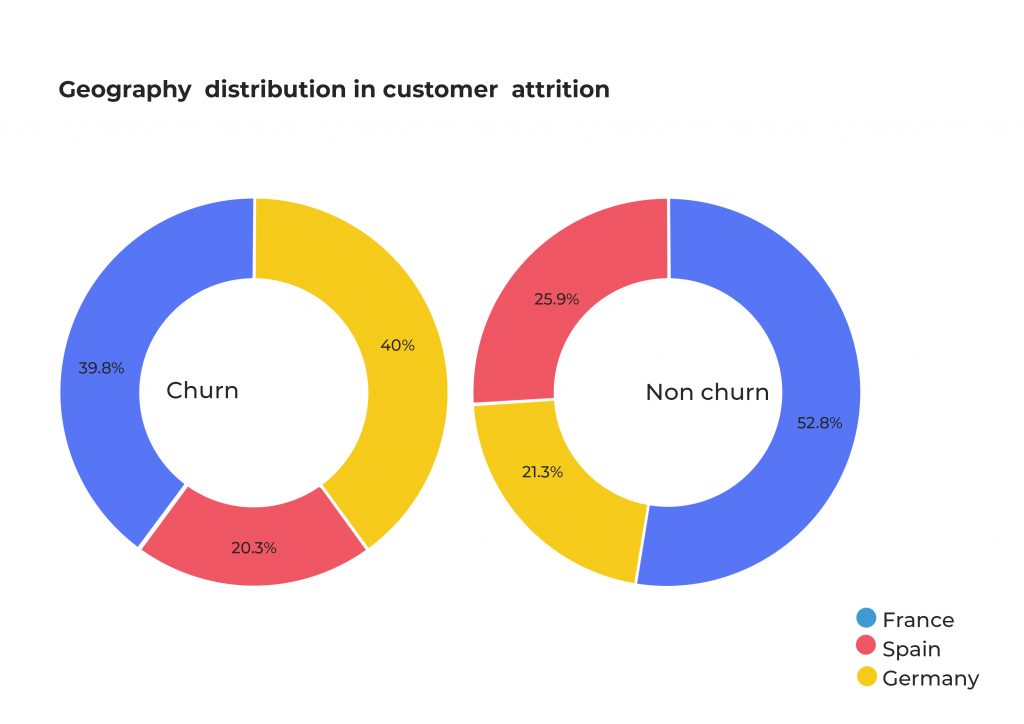
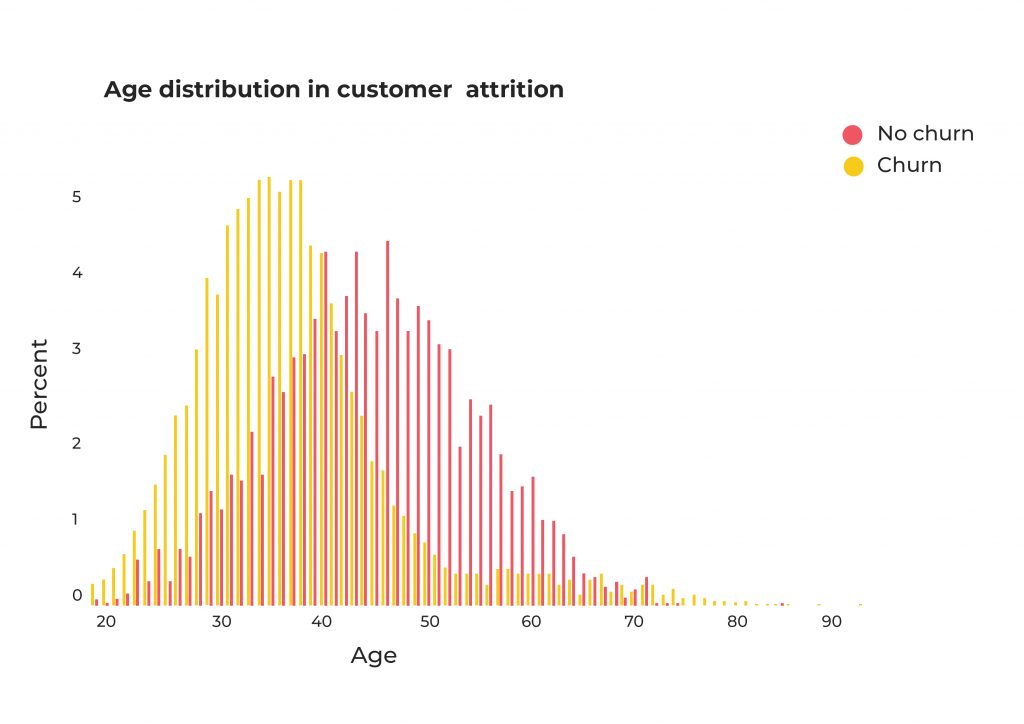
EDA: Distribution analysis of Churn and Non-Churn customers
As part of the Exploratory Data Analysis process, in the following step we analyzed the distributions of other variables for the Leaving (Churn) and Remaining (Non Churn) customers. This is extremely useful! It provides an insight into the data, identifying if the data contains outliers or if the dataset is unbalanced. We can now start to formulate hypotheses. Categorical data, such as gender or nationality, appears in a pie chart. On the other hand, numerical data such as credit score or balance is shown as a bar chart.
|
1 2 3 4 5 6 7 8 9 10 11 12 13 14 15 16 17 18 19 20 21 22 23 24 25 26 27 28 29 30 31 32 33 34 35 36 37 38 39 40 41 42 43 44 45 46 47 48 49 50 51 52 53 54 55 56 57 58 59 60 61 62 63 64 65 66 67 68 69 70 71 72 73 74 75 76 77 78 79 80 81 82 83 84 85 86 87 88 89 90 91 92 93 94 95 96 97 98 99 100 101 102 103 104 105 106 107 108 109 110 111 112 113 114 115 116 117 118 119 120 121 122 123 124 125 126 127 128 129 130 131 132 133 134 135 136 137 138 139 140 141 142 143 144 145 146 147 148 149 150 151 152 153 154 155 156 157 158 159 160 161 162 163 164 165 166 167 168 169 170 171 172 173 |
import pandas as pd import seaborn as sns#visualization import plotly.offline as py#visualization py.init_notebook_mode(connected=True)#visualization import plotly.graph_objs as go#visualization import plotly.tools as tls#visualization import plotly.figure_factory as ff#visualization import matplotlib.pyplot as plt import matplotlib as mpl mpl.style.use('ggplot') churn = df[df["Exited"] == 1] not_churn = df[df["Exited"] == 0] def plot_pie(column) : trace1 = go.Pie(values = churn[column].value_counts().values.tolist(), labels = churn[column].value_counts().keys().tolist(), hoverinfo = "label+percent+name", domain = dict(x = [0,.48]), name = "Churn", marker = dict(line = dict(width = 2, color = "rgb(243,243,243)") ), hole = .6 ) trace2 = go.Pie(values = not_churn[column].value_counts().values.tolist(), labels = not_churn[column].value_counts().keys().tolist(), hoverinfo = "label+percent+name", marker = dict(line = dict(width = 2, color = "rgb(243,243,243)") ), domain = dict(x = [.52,1]), hole = .6, name = "Non churn" ) layout = go.Layout(dict(title = column + " distribution in customer attrition ", plot_bgcolor = "rgb(243,243,243)", paper_bgcolor = "rgb(243,243,243)", annotations = [dict(text = "Churn", font = dict(size = 13), showarrow = False, x = .15, y = .5), dict(text = "Non churn", font = dict(size = 13), showarrow = False, x = .88,y = .5 ) ] ) ) data = [trace2,trace1] fig = go.Figure(data = data,layout = layout) py.iplot(fig) #function for histogram for customer attrition types def histogram(column) : trace1 = go.Histogram(x = churn[column], histnorm= "percent", name = "Churn", marker = dict(line = dict(width = .5, color = "black" ) ), opacity = .9 ) trace2 = go.Histogram(x = not_churn[column], histnorm = "percent", name = "Non churn", marker = dict(line = dict(width = .5, color = "black" ) ), opacity = .9 ) data = [trace2,trace1] layout = go.Layout(dict(title =column + " distribution in customer attrition ", plot_bgcolor = "rgb(243,243,243)", paper_bgcolor = "rgb(243,243,243)", xaxis = dict(gridcolor = 'rgb(255, 255, 255)', title = column, zerolinewidth=1, ticklen=5, gridwidth=2 ), yaxis = dict(gridcolor = 'rgb(255, 255, 255)', title = "percent", zerolinewidth=1, ticklen=5, gridwidth=2 ), ) ) fig = go.Figure(data=data,layout=layout) py.iplot(fig) #function for scatter plot matrix for numerical columns in data def scatter_matrix(df) : df = df.sort_values(by = "Exited" ,ascending = False) classes = df["Exited"].unique().tolist() classes class_code = {classes[k] : k for k in range(2)} class_code color_vals = [class_code[cl] for cl in df["Exited"]] color_vals pl_colorscale = "Portland" pl_colorscale text = [df.loc[k,"Exited"] for k in range(len(df))] text trace = go.Splom(dimensions = [dict(label = "Tenure", values = df["Tenure"]), dict(label = 'Balance', values = df['Balance']), dict(label = 'EstimatedSalary', values = df['EstimatedSalary'])], text = text, marker = dict(color = color_vals, colorscale = pl_colorscale, size = 3, showscale = False, line = dict(width = .1, color='rgb(230,230,230)' ) ) ) axis = dict(showline = True, zeroline = False, gridcolor = "#fff", ticklen = 4 ) layout = go.Layout(dict(title = "Scatter plot matrix for Numerical columns for customer attrition", autosize = False, height = 800, width = 800, dragmode = "select", hovermode = "closest", plot_bgcolor = 'rgba(240,240,240, 0.95)', xaxis1 = dict(axis), yaxis1 = dict(axis), xaxis2 = dict(axis), yaxis2 = dict(axis), xaxis3 = dict(axis), yaxis3 = dict(axis), ) ) data = [trace] fig = go.Figure(data = data,layout = layout ) py.iplot(fig) cat_cols = ["Geography", "Gender", "NumOfProducts","HasCrCard", "IsActiveMember"] num_cols = ["Age", "Balance", "EstimatedSalary","CreditScore","Tenure"] #for all categorical columns plot pie for i in cat_cols : plot_pie(i) #for all categorical columns plot histogram for i in num_cols : histogram(i) |
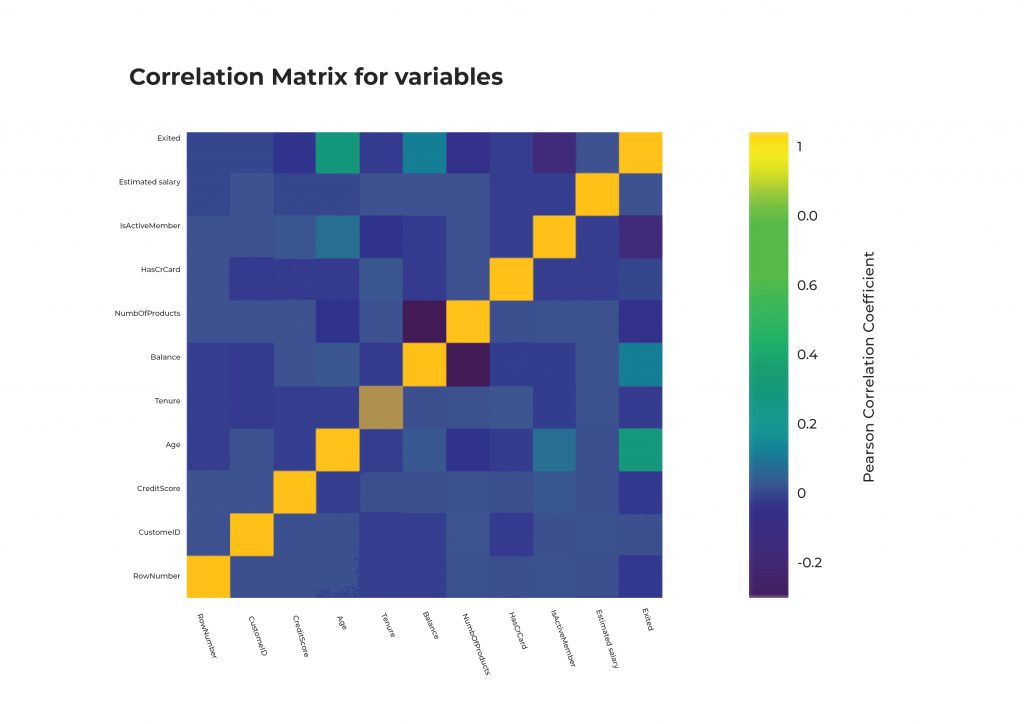
EDA: Identifying interactions using a Correlation Matrix
A correlation matrix is used to visualize the correlations between each column in the dataset.
As we can see from the first row, the Exited column has a positive correlation with Age and Balance, and a negative correlation with IsActiveMember and NumberOfProducts.
This analysis helps us formulate a hypothesis concerning which are the most important features for our problem.
|
1 2 3 4 5 6 7 8 9 10 11 12 13 14 15 16 17 18 19 20 21 22 23 24 25 26 27 28 29 30 31 |
correlation = df.corr() #tick labels matrix_cols = correlation.columns.tolist() #convert to array corr_array = np.array(correlation) #Plotting trace = go.Heatmap(z = corr_array, x = matrix_cols, y = matrix_cols, colorscale = "Viridis", colorbar = dict(title = "Pearson Correlation coefficient", titleside = "right" ) , ) layout = go.Layout(dict(title = "Correlation Matrix for variables", autosize = False, height = 720, width = 800, margin = dict(r = 0 ,l = 210, t = 25,b = 210, ), yaxis = dict(tickfont = dict(size = 9)), xaxis = dict(tickfont = dict(size = 9)) ) ) data = [trace] fig = go.Figure(data=data,layout=layout) py.iplot(fig) |
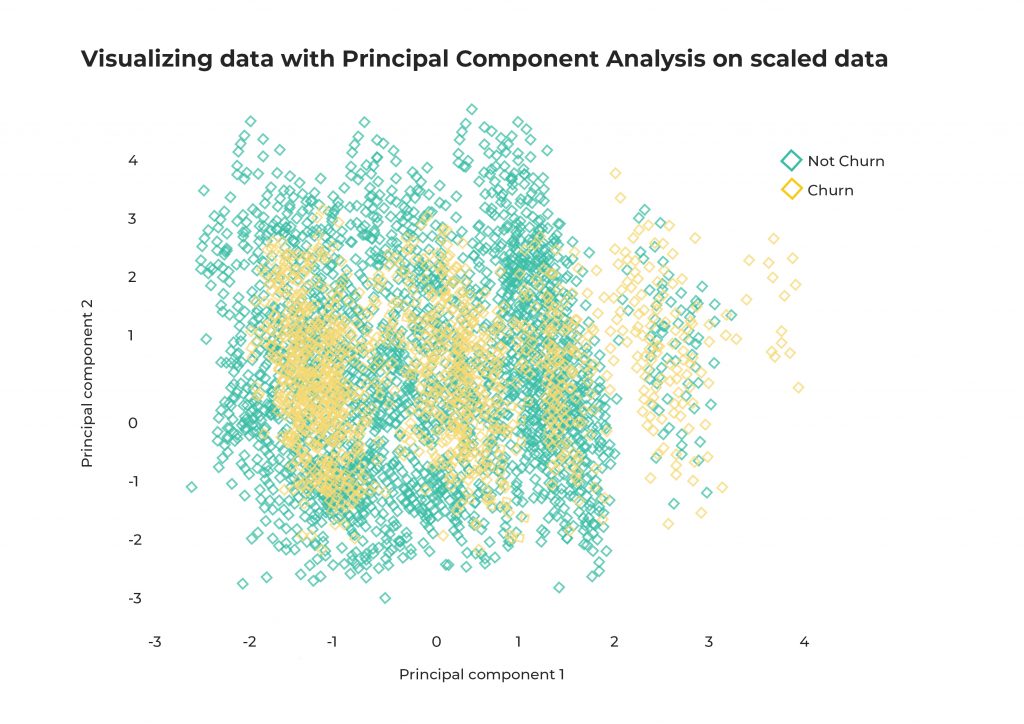
EDA: Principal Component Analysis (PCA)
PCA is an unsupervised learning technique for identifying patterns and clusters, and reducing the dimensionality of a dataset.
Considering that our dataset has 14 columns of which 3 are for identification (RowNumber, CustomerId, Surname) and 1 is the value we want to predict (Exited) we are left with 9 columns.
Visualizing something using 9 dimensions is quite difficult. Therefore, we can simplify this complexity by reducing the dimensionality of the dataset using PCA.
From the visualizations we can understand that there’s not a clear linear separation between the Churn and Non-Churn customers. This allows us to exclude linear classifiers from our experiment.
|
1 2 3 4 5 6 7 8 9 10 11 12 13 14 15 16 17 18 19 20 21 22 23 24 25 26 27 28 29 30 31 32 33 34 35 36 37 38 39 40 41 42 43 44 45 46 47 48 49 50 51 52 53 |
from sklearn.decomposition import PCA from sklearn.preprocessing import scale, normalize pca = PCA(n_components = 2) Id_col = ['RowNumber', 'CustomerId', 'Surname'] target_col = ["Exited"] X = df[[i for i in df.columns if i not in Id_col + target_col]] Xscal = scale(X) Xnorm = normalize(X) Y = df[target_col + Id_col] def plot(X,Y, title): principal_components = pca.fit_transform(X) pca_data = pd.DataFrame(principal_components,columns = ["PC1","PC2"]) pca_data = pca_data.merge(Y,left_index=True,right_index=True,how="left") pca_data["Churn"] = pca_data["Exited"].replace({1:"Churn",0:"Not Churn"}) def pca_scatter(target,color) : tracer = go.Scatter(x = pca_data[pca_data["Churn"] == target]["PC1"] , y = pca_data[pca_data["Churn"] == target]["PC2"], name = target,mode = "markers", marker = dict(color = color, line = dict(width = .5), symbol = "diamond-open"), text = ("Customer Id : " + pca_data[pca_data["Churn"] == target]['Surname']) ) return tracer layout = go.Layout(dict(title = title, plot_bgcolor = "rgb(243,243,243)", paper_bgcolor = "rgb(243,243,243)", xaxis = dict(gridcolor = 'rgb(255, 255, 255)', title = "principal component 1", zerolinewidth=1,ticklen=5,gridwidth=2), yaxis = dict(gridcolor = 'rgb(255, 255, 255)', title = "principal component 2", zerolinewidth=1,ticklen=5,gridwidth=2), height = 600 ) ) trace1 = pca_scatter("Churn",'red') trace2 = pca_scatter("Not Churn",'royalblue') data = [trace2,trace1] fig = go.Figure(data=data,layout=layout) py.iplot(fig) plot(X,Y, "Visualizing data with Principal Component Analysis on raw data") plot(Xnorm,Y, "Visualizing data with Principal Component Analysis on normalized data") plot(Xscal,Y, "Visualizing data with Principal Component Analysis on scaled data") |
Prepare the dataset
In this phase we will prepare our dataset for training. Generally speaking in each ML or DL project we need to select relevant features. Therefore, we can create a training set and an evaluation set that will be used by our model to learn and understand patterns from the data. Here we will select the columns needed for the training process and split our dataset into 2 sets, a training set and a testing set.
The training data will be used by the model to fit the parameters during the training (learning) process. The test data will be used to evaluate the performance of the model on unknown data.
|
1 2 3 4 |
X = df[['CreditScore', 'Geography','Gender', 'Age', 'Tenure', 'Balance', 'NumOfProducts', 'HasCrCard','IsActiveMember']] y = df["Exited"] from sklearn.model_selection import train_test_split X_train, X_test, Y_train, Y_test = train_test_split(X, y, test_size=0.20, random_state=42) |
Customer churn model training and evaluation
For this problem we will use a gradient boosting technique called xgboost.
XGBoost is an optimized distributed gradient boosting library designed to be highly efficient, flexible and portable. It implements machine learning algorithms under the Gradient Boosting framework. XGBoost provides a parallel tree boosting (also known as GBDT, GBM) that solves many data science problems quickly and accurately. The same code can run on distributed environments such as Hadoop, SGE, MPI and can solve problems that contain billions of examples
In this section we define the model hyperparameters and convert the datasets to use with xgboost.
We run the training process for 60 epochs, and evaluate against the testing set using the following metrics:
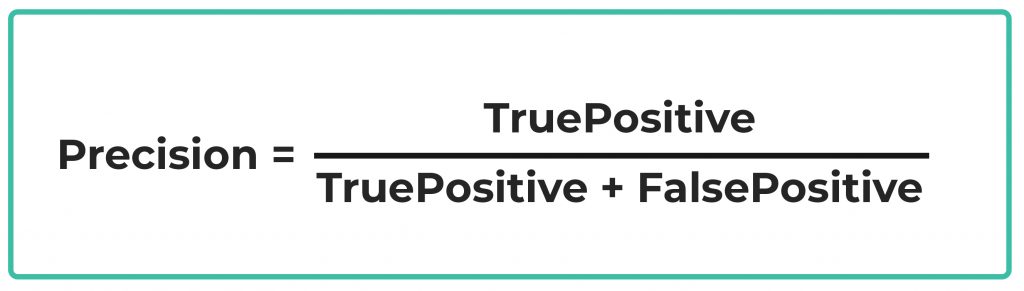
Precision
This metric evaluates how precise a model is in predicting positive labels. It answers the question, out of the number of times a model predicted positive, how often was it correct?
Recall
Often called sensitivity, the recall calculates the percentage of actual positives a model correctly identified (True Positive).

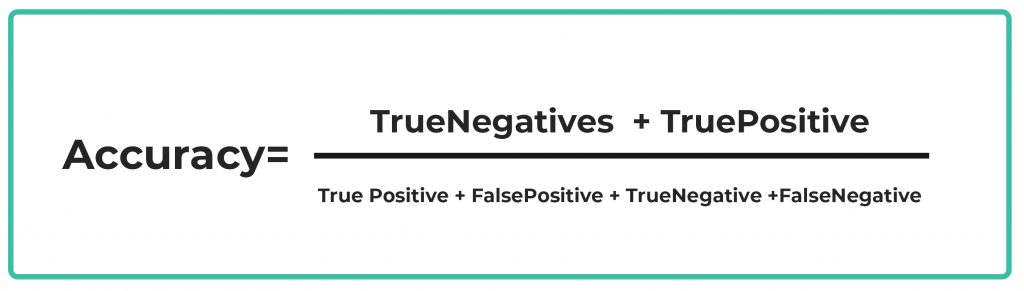
Accuracy
Accuracy is an evaluation metric that allows you to measure the total number of predictions a model gets right.
|
1 2 3 4 5 6 7 8 9 |
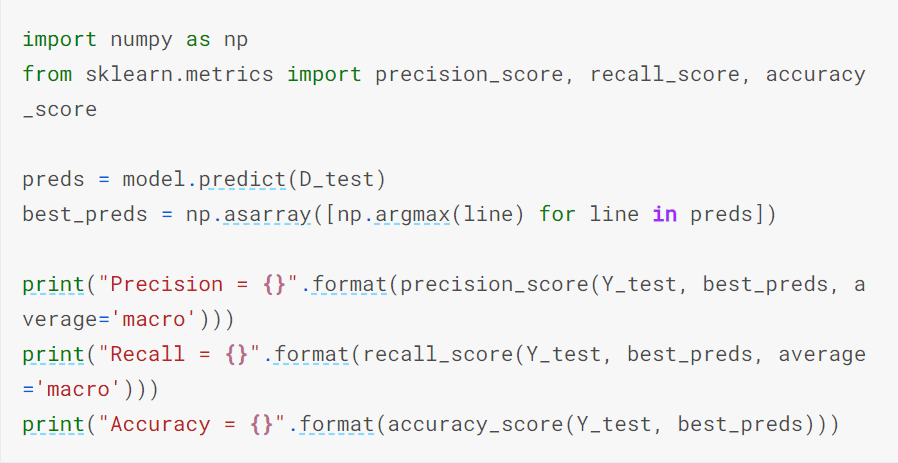
import numpy as np from sklearn.metrics import precision_score, recall_score, accuracy_score preds = model.predict(D_test) best_preds = np.asarray([np.argmax(line) for line in preds]) print("Precision = {}".format(precision_score(Y_test, best_preds, average='macro'))) print("Recall = {}".format(recall_score(Y_test, best_preds, average='macro'))) print("Accuracy = {}".format(accuracy_score(Y_test, best_preds))) |
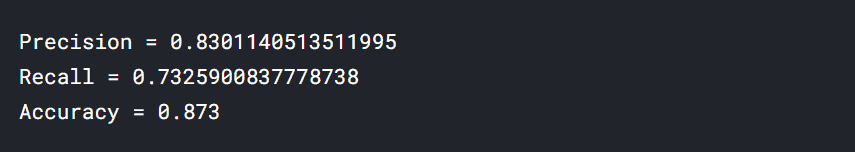
Good job! Our initial model has an accuracy score of 87.30%, precision of 83.01% and a sensitivity of 73.25%. Great news!
Feature importance
One of the characteristics of Xgboost is the ability to understand what are the most important features in the dataset.
We can do this by plotting the feature importance plot. That way, we can verify if our hypothesis from the data analysis section is correct.
|
1 2 3 |
# Feature importance from xgboost import plot_importance plot_importance(model) |
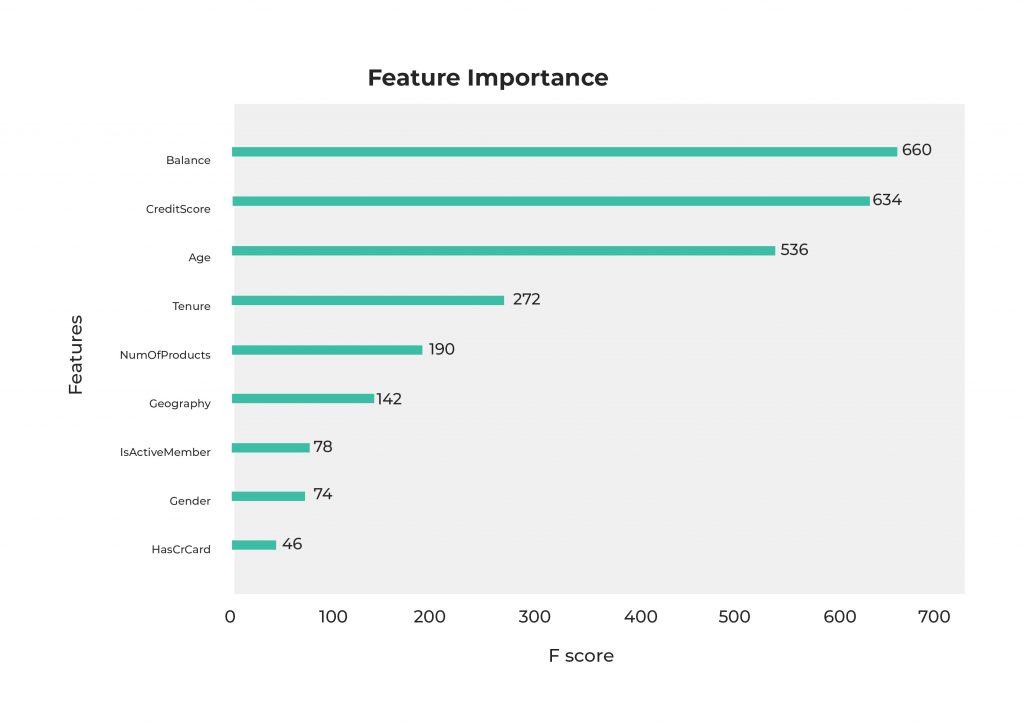
We predicted that Age, Balance, IsActiveMember and NumberOfProducts were the most important columns and we were right for Balance and Age and partially right on NumOfProducts but we did not see any evidence of the importance of CreditScore or Tenure.
Using these findings we can iterate over the data preparation / training / evaluation to optimize the performance of our model. In this case we’re working with a small amount of data. However, in a production environment we could have hundreds of columns describing a client. Therefore, identifying which columns are those describing the problem will be key for the development of a reliable and accurate model.
Production
Now that we have our predictive model and can successfully identify if a customer will churn, the next step is to run it in production.
In order to do this we’re going to run the model on a daily schedule using the latest available data. Remember to apply the same transformations used to generate the training dataset.
If we analyze the prediction result from the model we can maximize the information obtained.
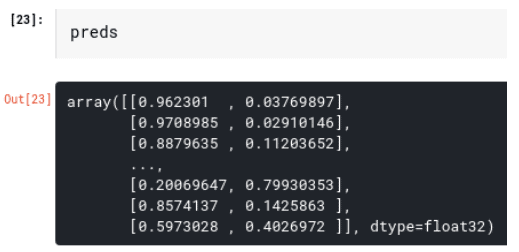
In the last cell we printed out the prediction matrix from the model. Every element of the array preds describes the probabilities of a customer to be churn or not-churn. In the example above, the first customer has a 96.23% probability to be not-churn and a 3.76% to be churn, therefore we can state that this customer is a non-churning customer. The fourth customer in contrast has a 20.06% probability to be not-churn and a 79.93% to be churn indicating he/she is a churn customer.
Using this data we can also identify situations where we are not really sure if a customer will be churning or not, like the last customer on the list, where the churn and not-churn probabilities are very similar (0.59% not-churn, 0.40% churn). During this stage we should also identify a threshold value that we can use to determine if a customer is churn or not-churn.
Final thoughts on churn prediction with Machine Learning
In production we can generate a daily report of future churning customers and this report can be sent directly to the customer service team who can then contact customers on the list to better understand their needs or propose new offers, different products or whatever ‘win-back strategy’ is in place.
To sum up, in this post we showcased churn prediction with Machine Learning by creating a predictive model to identify customer churn. We specifically used a dataset from a financial service firm. However, regardless what industry you’re in, or your strategy to mitigate customer churn, you can stay proactive and anticipate your customer’s next move based on this type of analysis. As with anything in life and business, time is of the essence.